
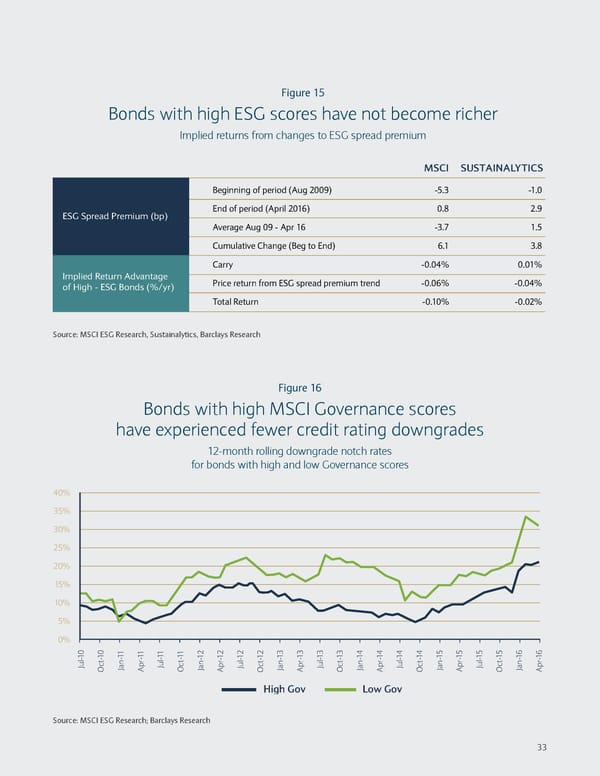
Figure 15 Bonds with high ESG scores have not become richer Implied returns from changes to ESG spread premium MSCI SUSTAINALYTICS Beginning of period (Aug 2009) -5.3 -1.0 ESG Spread Premium (bp) End of period (April 2016) 0.8 2.9 Average Aug 09 - Apr 16 -3.7 1.5 Cumulative Change (Beg to End) 6.1 3.8 Carry -0.04% 0.01% Implied Return Advantage Price return from ESG spread premium trend -0.06% -0.04% of High - ESG Bonds (%/yr) Total Return -0.10% -0.02% Source: MSCI ESG Research, Sustainalytics, Barclays Research Figure 16 Bonds with high MSCI Governance scores have experienced fewer credit rating downgrades 12-month rolling downgrade notch rates for bonds with high and low Governance scores 40% 35% 30% 25% 20% 15% 10% 5% 0% 10 10 1 11 11 11 2 12 12 12 3 13 13 13 4 14 14 14 5 15 15 15 6 16 Jul- t- -1 Jul- t- -1 Jul- t- -1 Jul- t- -1 Jul- t- -1 Jul- t- -1 Oc Jan Apr- Oc Jan Apr- Oc Jan Apr- Oc Jan Apr- Oc Jan Apr- Oc Jan Apr- High Gov Low Gov Source: MSCI ESG Research; Barclays Research 33
 Sustainable Investing and Bond Returns Page 36 Page 38