
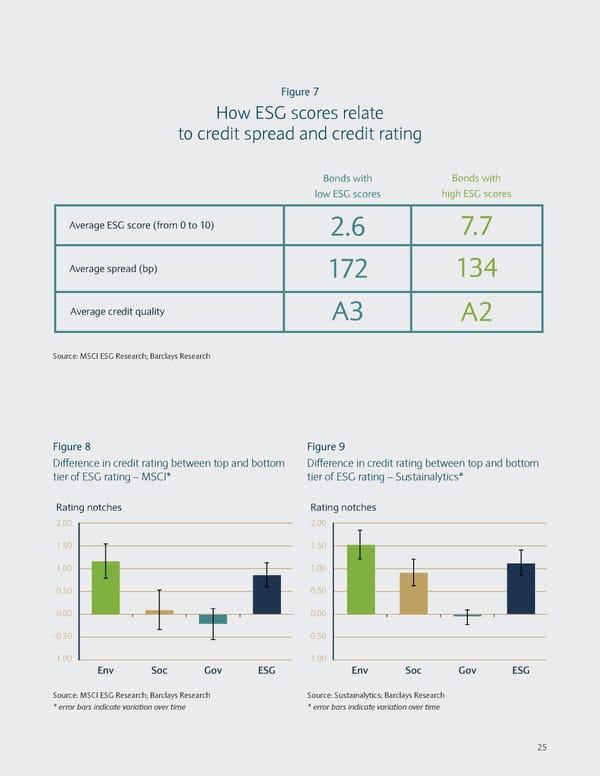
Figure 7 How ESG scores relate to credit spread and credit rating Bonds with Bonds with low ESG scores high ESG scores Average ESG score (from 0 to 10) 2.6 7.7 Average spread (bp) 172 134 Average credit quality A3 A2 Source: MSCI ESG Research; Barclays Research Figure 8 Figure 9 Difference in credit rating between top and bottom Difference in credit rating between top and bottom tier of ESG rating – MSCI* tier of ESG rating – Sustainalytics* Rating notcheRating notchesRsRating notchesating notches 2.00 2.00 2.00 2.00 1.50 1.50 1.50 1.50 1.00 1.00 1.00 1.00 0.50 0.50 0.50 0.50 0.00 0.00 0.00 0.00 -0.50 -0.50 -0.50 -0.50 -1.00 -1.00 -1.00 -1.00 Env Env Soc Soc Gov Gov ESG ESG Env Env Soc Soc Gov Gov ESG ESG Source: MSCI ESG Research; Barclays Research Source: Sustainalytics; Barclays Research * error bars indicate variation over time * error bars indicate variation over time 25
 Sustainable Investing and Bond Returns Page 27 Page 29