
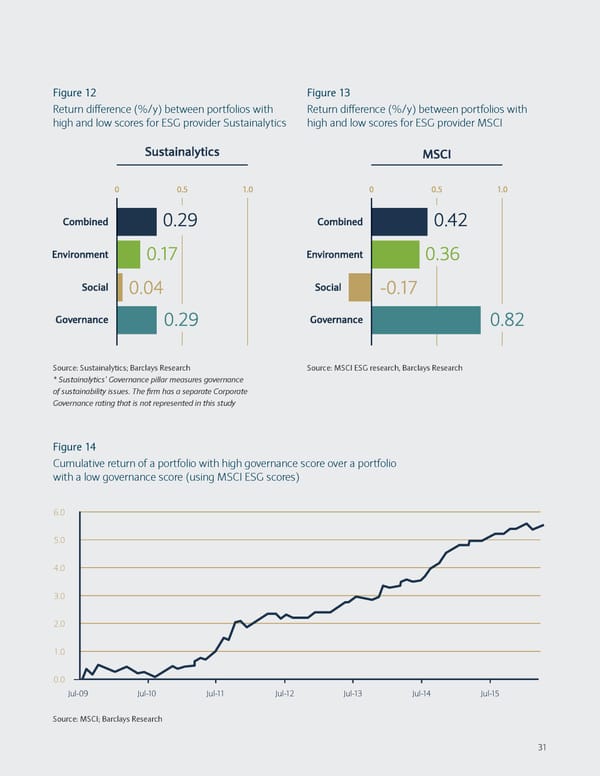
Figure 12 Figure 13 Return difference (%/y) between portfolios with Return difference (%/y) between portfolios with high and low scores for ESG provider Sustainalytics high and low scores for ESG provider MSCI Source: Sustainalytics; Barclays Research Source: MSCI ESG research, Barclays Research * Sustainalytics’ Governance pillar measures governance of sustainability issues. The firm has a separate Corporate Governance rating that is not represented in this study Figure 14 Cumulative return of a portfolio with high governance score over a portfolio with a low governance score (using MSCI ESG scores) 6.0 5.0 4.0 3.0 2.0 1.0 0.0 Jul-09 Jul-10 Jul-11 Jul-12 Jul-13 Jul-14 Jul-15 Source: MSCI; Barclays Research 31
 Sustainable Investing and Bond Returns Page 34 Page 36